- Which of the following is the formula for determining the rate of growth of a population?
- (birth rate + immigration rate) - (death rate + emigration rate)
- (birth rate - death rate) + immigration rate + emigration rate
- birth rate + death rate + immigration rate + emigration rate
- (immigration rate + emigration rate) - (death rate + birth rate)
- As a population grows, factors that slow or limit the growth of the population include
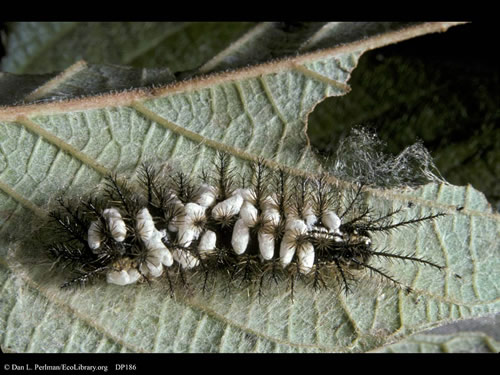
Creative commons attribution: copyright Dan L. Perlman, 1988
The caterpillar pictured here has wasp pupae attached that will hatch and then consume the caterpillar. This relationship is an example of- sexual selection
- commensalism
- mutualism
- parasitism
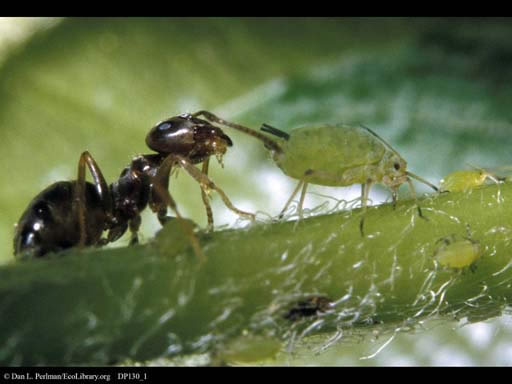
Creative commons attribution: copyright Dan L. Perlman, 1988
Ants are known to protect, or "tend" aphids from predators, and in return receive some nutrients from the aphids. This relationship is an example of- sexual selection
- commensalism
- mutualism
- parasitism
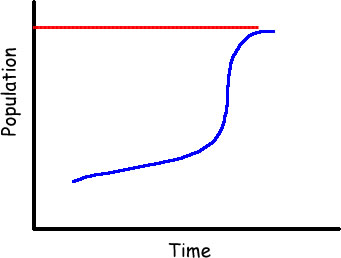
The growth curve shown above is an example of- exponential growth
- logistic growth
- extinction
- a predator-prey relationship

In the growth curve shown above, the red line indicates- K, the carrying capacity
- the y-intercept
- the death rate
- the reproductive rate
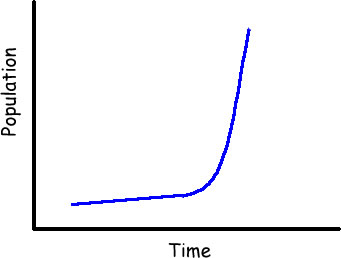
The growth curve shown above is an example of- exponential growth
- logistic growth
- extinction
- a predator-prey relationship
- Examples of symbiotic relationships include
- Which of the following is an example of a community?
- All of the organisms living within a lake.
- All of the geese in the world.
- All of the grass in a meadow.
- All of the animals in North America.
- Which of the following is an example of a population?
- All of the raccoons in a forest
- All of the mammals in a forest
- All of the trees in a forest
- All of the raccoons in North America
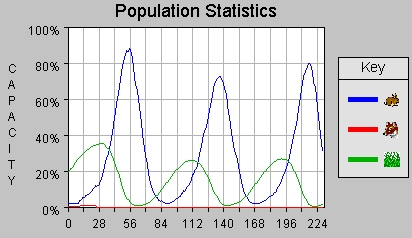
The image above is a population graph from the predator-prey game. Green indicates grass, blue indicates rabbits, and red indicates wolves. In this graph, the factor controlling the population of rabbits is:- the availability of food
- the presence of predators
- the presence of predators and the availability of food
- competition from other herbivores
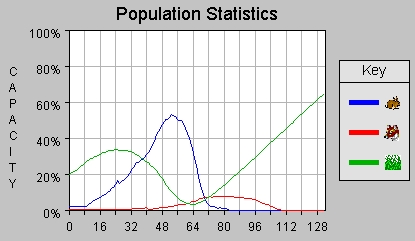
The image above is a population graph from the predator-prey game. Green indicates grass, blue indicates rabbits, and red indicates wolves. The rapid growth in grass shown at the right of the graph is probably due to:- wolves controlling the rabbit population
- rabbits going on diets
- rabbits becoming extinct
- wolves becoming extinct
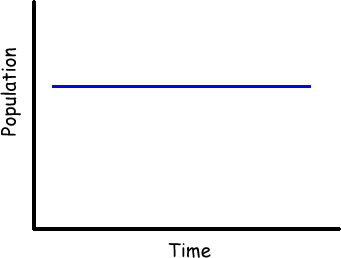
The growth curve above indicates that in this population- extinction has occurred
- births + immigration = deaths + emigration
- births + emigration = deaths + immigration
- the ecosystem must be at its carrying capacity

The image above is a population graph from the predator-prey game. Green indicates grass, blue indicates rabbits, and red indicates wolves. Wolves appear to have gone extinct because:- there was no grass for rabbits to eat
- they starved after eating all of the rabbits
- they ran out of grass to eat
- other predators replaced them
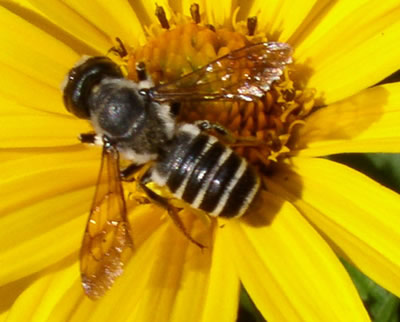
Bees collect nectar from flowers, and serve as pollinators for the plants. This relationship is an example of- mutualism
- predator-prey
- commensalism
- parasitism
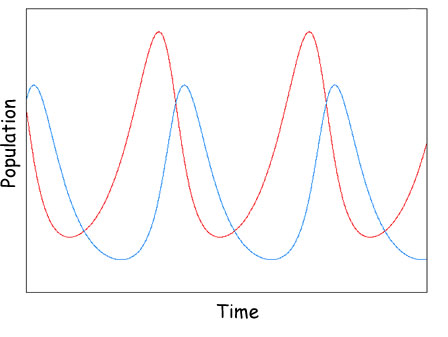
In this diagram the predator is coded in ____________ and the prey is coded in ____________.- blue / red
- red / blue
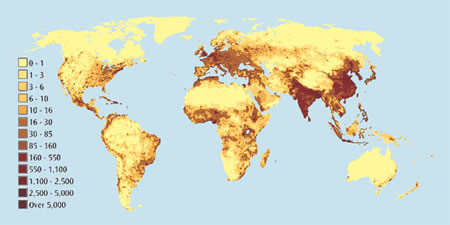
As this diagram indicates, human population is distributed in a pattern of- random dispersion
- clumped dispersion
- uniform dispersion
- A relationship between two organisms of different species in which one benefits, while the other neither benefits nor is harmed:
- symbiosis
- mutualism
- commensalism
- parasitism